.jpeg)
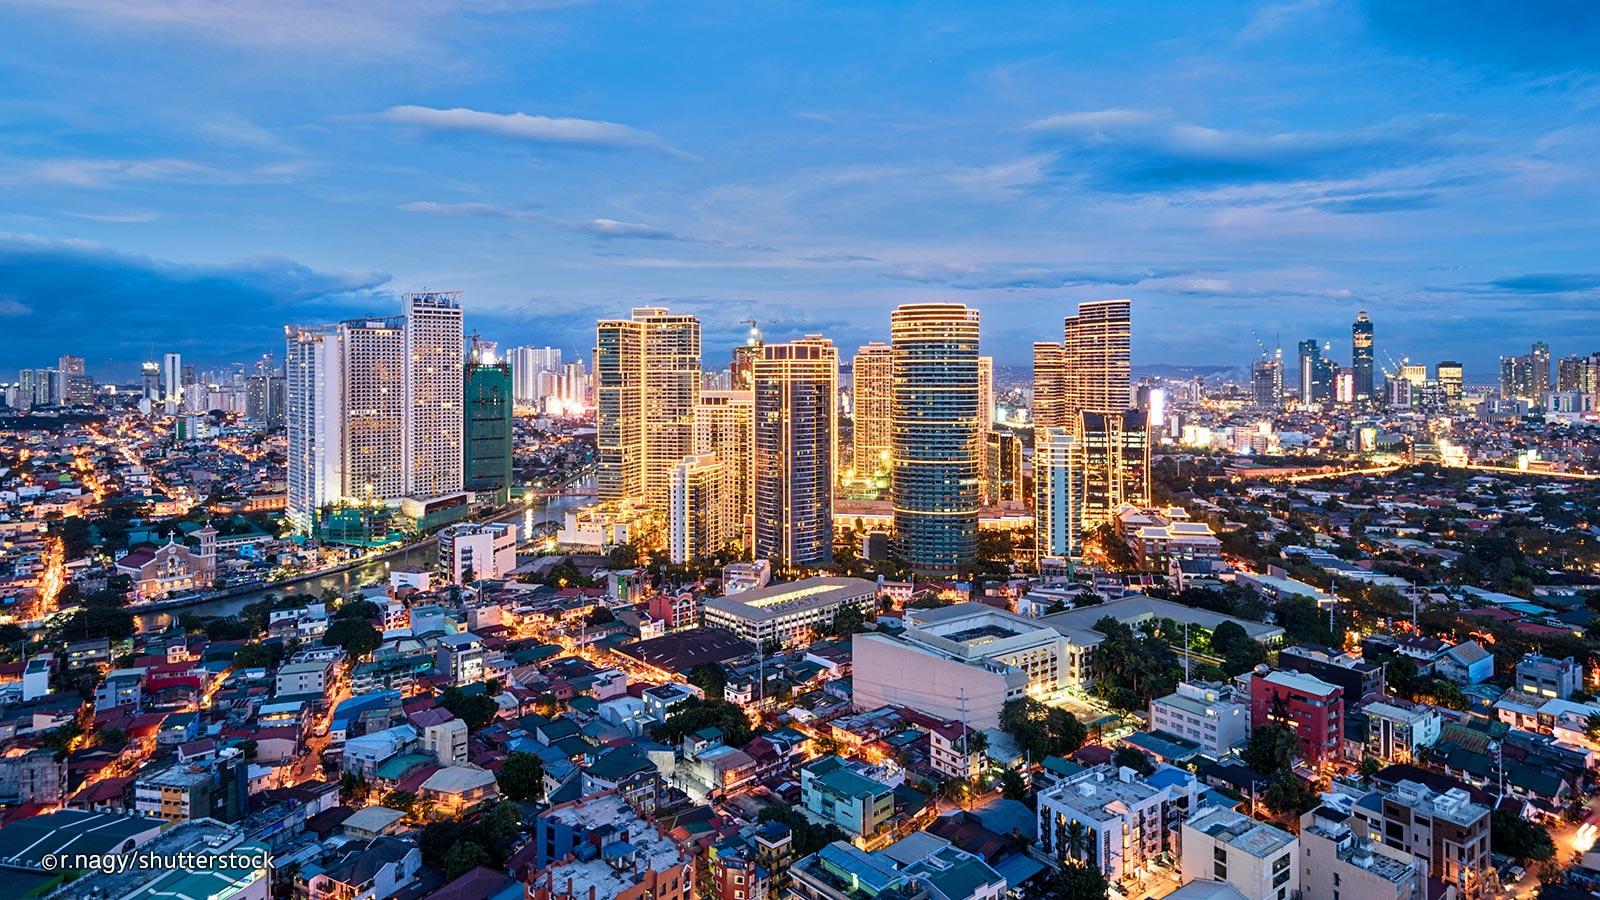
The Philippines' capital city of Manila led the Knight Frank Prime International Residential Index (PIRI 100) after luxury home prices jumped 11% last year, bolstered by a lack of supply and a thriving domestic economy.
However, Manila's performance pales in comparison with the top growing residential markets of the past tracked by the index. In the 12 years that Knight Frank has monitored the value of 100 luxury residential markets, the best-performing city has yet to record annual growth below 21%.
Nicholas Holt, Head of Research, Knight Frank Asia Pacific says, "While Manila's 11% growth is far from the norm for the city, it confirms the theory that outliers are disappearing, and we are moving to a period of slower price growth. Within Asia-Pacific, a slowdown from a 4.9% average growth rate in 2017 to 2.7% in 2018 illustrates this trend."
Singapore was the only other city in Asia-Pacific that emerged in the top ten of the PIRI 100. The city-state witnessed more demand for luxury homes following changes to the Seller Stamp Duty regulations. Last year saw prices climbing 9.1%; however, cooling measures introduced in mid-2018, including stamp duties for developers and non-residents, slowed the market considerably, and prices are expected to remain static this year. The third-best performing Asian city is Tokyo, where prices climbed 6.8%.
Dominic Heaton-Watson, Associate Director, International Residential Project Marketing, Knight Frank Malaysia comments, "Of note, Berlin was one of the top performing European residential markets in the past 12 months, and witnessed increasing levels of interest from Malaysia-based investors seeking both capital growth and strong rental returns."
Knight Frank's PIRI 100 top 10 performing markets City : % Change (Dec 2017 to Dec 2018)
Manila : 11.1% Edinburgh : 10.6% Berlin : 10.5% Munich : 10.0% Buenos Aires : 10.0% Mexico City : 9.5% Singapore : 9.1% Boston : 8.6% Madrid : 8.1% San Francisco : 7.8%
[ Sources: All data comes from Knight Frank's global network with the exception of: Tokyo (Ken Corporation); São Paulo and Rio de Janeiro (Fundação Instituto de Pesquisas Econômicas); Oslo (Torbjørn Ek); Chicago, Los Angeles, Miami, New York, San Francisco, Seattle and Washington DC (S&P CoreLogic Case-Shiller); Barcelona (Ministerio de Fomento); Jersey (States of Jersey); Berlin and Frankfurt (ImmobilienScout 24); Toronto (Toronto Real Estate Board); Mexico (Sociedad Hipotecaria Federal); Stockholm (Svensk Mäklarstatistik AB). ]
Asia-Pacific Prime Residential Market
Overall, luxury home prices in Asia-Pacific gained 2.7% with most markets experiencing low, yet steady growth. However, growth in the region was still higher than the global average. In 2018, the PIRI 100 recorded its lowest rate of annual increase since 2012 as the value of prime residential markets around the world rose by only an average of 1.3%, down from 2.1% in 2017. The index sees an annual price change of 1% in Malaysia's luxury residential market from December 2017 to December 2018.
"The slowdown in the PIRI 100 last year is a consequence of increasing global interest rates.
"As ultra-low interest rates have driven the global real estate markets since 2008, it is inevitable for the markets to experience lower price growth amid the shift in monetary policy," adds Holt.
In terms of the cost of prime residential real estate, Hong Kong is the second-most expensive market in the world. Every US$1 million spent buys only 22 square metres (sq m) of luxury property in the territory. Singapore with 36 sq m is the fifth most costly place to buy prime residential property while Sydney is at eighth place (52 sq m) and Shanghai at tenth (57 sq m).
Square metres of luxury property US$1m will buy around the world City : Sq m per US$1m
Monaco : 16 Hong Kong : 22 New York : 31 London : 31 Singapore : 36 Los Angeles : 39 Geneva : 41 Paris : 46 Sydney : 52 Shanghai : 57
Data as at December 2018 Sources: Knight Frank Research, Douglas Elliman, Ken Corporation


.jpeg "Sidebox")